(Note: Show and telecom network statistics are located further down this page, past the volunteer thanks and sub-page index sections.)
On behalf of VCFMW, Shadytel Midwest, and the other VCFMW LECs, I thank all of the volunteers and staff who helped with the telecom network.
Without their help, we could not have successfully grown to a service footprint of nearly 100,000 square feet. We could not have serviced over 110 subscribers who collectively ordered over 300 individual services from POTS, to DSL, to T1, and other special services. We could not have deployed over 44,000 pair-feet of copper and 1,450 feet of fiber to deliver those services.
Volunteers and staff assisted with tasks ranging from planning, prep, setup, operations, and teardown. Whether they were helping me clean dirty old phones, taking an inventory of cable, building cables, punching down cross connects, deploying telephone poles, aerial cabling, drop lines, NIDs, telephones and telephone accessories, their help was absolutely vital. I cannot begin to count how many person-hours of work go into this, but it has grown well beyond one person and well beyond even a dedicated small team.
They all have my gratitude. I am already looking forward to next year and I hope to see many of them again.
I could not have done this without immense help from everybody above.
If I have spelled any names wrong, or you would like to change how your name is displayed above (including removing it or adding one I forgot), please contact me.
VCFMW 21 was September 12-13th, 2026. I once again offered telephony services at the show acting as Shadytel Midwest, the midwestern regional Shadytel operating company.
The information in these pages may be updated at any time leading up to, during, or even after the show, so check back for any updates.
See the various sub-pages for specific information:
There was a voicemail box set up as a guestbook at VCFMW 21. Read a bit about it here.
The telephone directory includes a list of all listed subscribers and services, as well as general dialplan and numbering information.
This page includes information on how to use and access the services offered to subscribers.
See this page for information about services offered and how to order them.
See this page for detailed information on how the network is arranged.
The rest of this page is a post-show account of how everything related to the telephone network went. I'll cover statistics about the show network, preparation, setup, operations, teardown, and work for the future.
As you might expect, the telephone network grew again this year. We'll explore the data and see how the network looked this year vs. previous years.
Before we dig into the details, here are some quick facts:
Before we can talk about the telephone network, we must first talk about the size of VCFMW to set the stage. The first topic we'll cover is simply the size of the space.
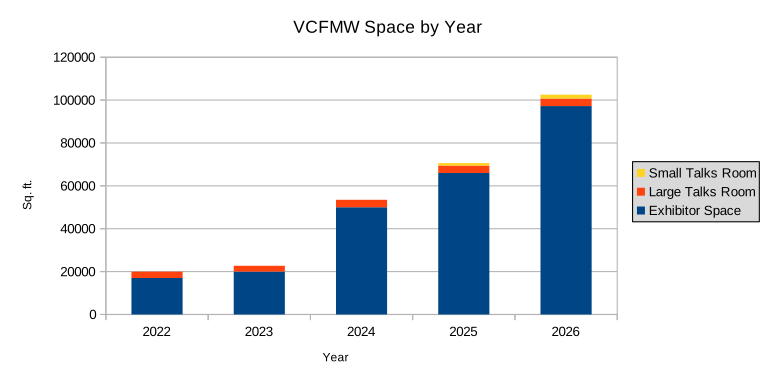
In 2023, the space for exhibitors grew by only about 18%. We had basically filled our existing venue and we only accomplished this modest increase in space by moving the talks to another room in the basement of the connected hotel.
In 2024, we moved to a completely new venue. The exhibit space increased to 2.5x our previous space. It was orginally only supposed to be 1.6x, but we filled it faster than we thought possible and had to increase a month or two before the show. The new space came with more stringent fire regulations as well, like larger aisle sizes which meant we couldn't pack the space quite as densely. We also increased the size of the talks room by about 15% over the previous venue.
In 2024, we grew another 32% on exhibit space as well as adding a second, smaller talks room. For larger talks like the youtube panel and the VCFMW auction, we were able to combine the two rooms to form one larger one (about 33% more space than the previous year).
This year, our exhibit space grew approximately 50% to nearly 100,000 square feet. For talks, we moved the rooms upstairs and added a third over by the hotel. For larger talks, we could again combine the two main rooms to form one larger one (about 15% more space than last year, plus the additional smallest room making 32% total)
With the increases in space, of course our exhibit count grows as well.
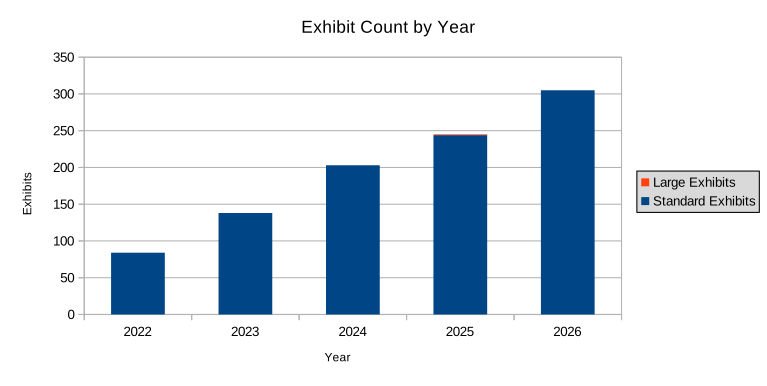
Exhibit count has grown approximately 40-60 exhibits each year since 2022. It is an interesting point that, so far, this has been approximately linear growth rather than exponential. The show has grown to a point where it will be difficult to expand further in this venue and it will be interesting to see how this is affected in future years.
Linear feet of table length is a good metric to measure as well, to measure the overall size of exhibits. In years past, and again this year, we end up with a mixture of 6'x30", 8'x30", 8'x18", and occasionally other sizes of table depending on availability from the venue and/or rental companies. Rather than count tables, we've found it is best to think in terms of feet of table length.
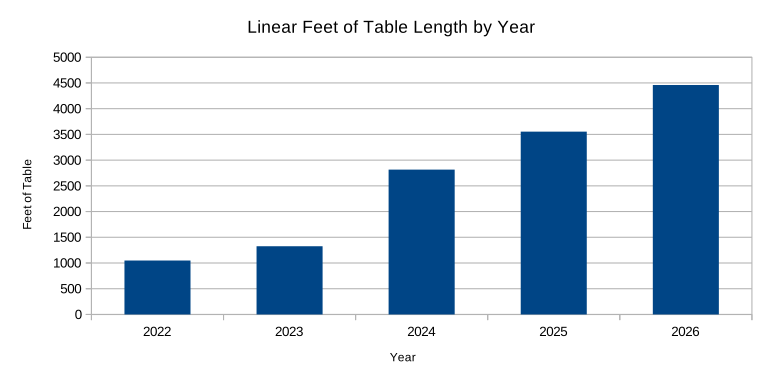
Note that the above chart and information below counts space allocations for standard exhibits including spaces allocated without a table (used for floor standing equipment, or exhibitor provided tables/shelves/etc.).
In 2023, we filled our existing venue to capacity (and overflowed, realistically) only allowing an increase in table space of about 27%. This is despite an increase in exhibit count of about 64%. In order to fit everybody we could, we asked people to keep their requests to a minimum and, in some cases, reached out directly to exhibitors to ask if they could reduce their request to allow us to squeeze another exhibitor in. In 2022, the average table length per exhibit was about 12.5 feet while we got it down to 9.6 feet in 2023.
With the massive increase in space in 2024, we were able to fit everybody again with minimal needs to reduce allocations. The linear feet of table went up 112% and the average feet of table per exhibit rose to about 13.9 feet per exhibit. Note that out of a 150% increase in square space, due to the requirements of the new venue, this only netted us an increase in linear table of 112%.
In 2025, we increased table length allocation by about 26% and hit an average of about 14.6 feet per exhibit. Contrast this with a 32% increase in total square space. Part of this discrepancy is due to the one large exhibit not being counted as 'table' space, another piece is a number of late cancellations we were unable to fill. Overall, I do think we had about the same or higher density over the previous year.
This year, we increased table length allocation by about 26% again. Contrasted with a 47% increase in total square space, we can see that we decreased density. That was a conscious decision to widen the aisles in an effort to decrease crowding during peak hours. That decision paid off, as we were able to fit all requests nearly perfectly.
With the growth in exhibit count, the demand for telephone services of course increases as well.
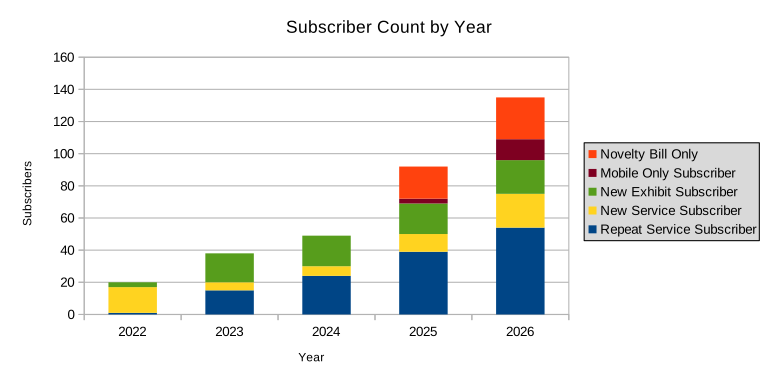
The chart above breaks down as follows:
There are some flaws in this counting method. It is easier to count this way, but it does not account for exhibits which were present on non-consecutive years, and it does not account for exhibits which use telephone services on non-consecutive years. In order to do so, I would need to look across multiple years of data all at once, which complicates the counting process.
Not counting the novelty-bill-only subscribers, subscriber count grew 51% this year. If we leave off the mobile-only subscribers, we go down a bit to 39% growth. Growth was 47% in 2025, 29% in 2024, and 90% in 2023. Compare that with exhibit growth of 25% this year, 20% in 2025, 47% in 2024, and 64% in 2023.
The irregularity of the growth of telephone subscribers when compared to the growth in number of exhibits is odd. I don't have a good explanation for this currently. I had hoped to gain some insight by looking at repeat subscribers vs. non-repeat subscribers, but this didn't help either.
On that point, however, we can see that telephone service retention was 75% in 2023, 63% in 2024, 80% in 2025, and 75% this year. In 2026, 2025, and 2023, established exhibits becoming new subscribers makes up for the attrition. In 2024, however, only the combination of established and new exhibit subscribers together was able to overcome the attrition.
Next, we'll dig into the services delivered. Most of these services are described on the telephone service ordering page, however some will be explained better below.
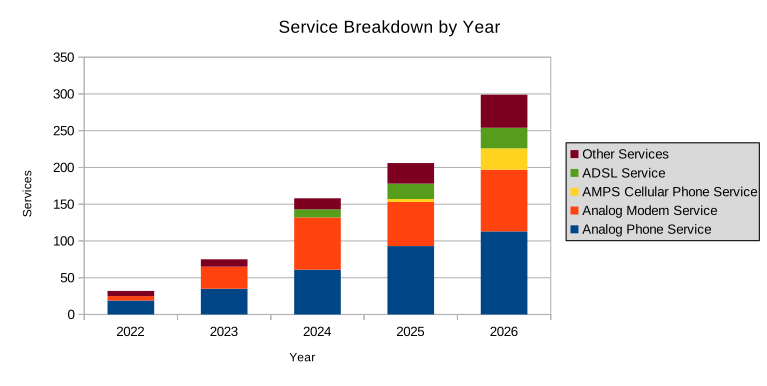
In the above chart, analog phone service is a POTS line intended for use with a telephone, analog modem service is a POTS line intended for use with a modem (or other equipment where it is desireable to have call waiting disabled), ADSL is internet access utilizing ADSL technology, and AMPS cellular service is used with analog cellular telephones. We will go into more detail on the 'Other Services' category later on.
Service count grew by 134% from 2022 to 2023, another 111% to 2024, just 30% to 2025, and finally 45% to 2026. The massive increase in 2023 can be explained by massive subscriber count growth as well as an increase in number of services requested by each subscriber from an average of 1.6 services per subscriber to 2.0. The massive increase in 2024 is, of course, also partly related to an increase in subscriber count, but also a large increase in services per subscriber again from 2.0 to 3.2. In 2025, subscriber counts grew more than they did in 2024, but a drop in services per subscriber to just 2.9 snubbed some of the service growth. Similarly in 2026, services per subscriber dropped slightly to 2.7.
Analog phones almost always outperform analog modems. In 2024, the modem line count did exceed the phone line count, but the loss of one exhibit with a large modem line count coupled with the realization that some equipment could be consolidated in the shadytel CO resulted in the loss of 14 modem lines this year. The subscriber turnover and churn didn't make up for that, meanwhile phone line counts increased by more than 50% meaning that in 2025, phone lines again exceeded modem lines. This trend continues in 2026.
ADSL service, first offered in 2024, grew less than overall subscriber growth this year, after it outpaced subscriber growth last year. We did exceed the capacity of a single DSLAM, predicted last year, resulting in adding a second 24-port DSLAM. We officially advertised the exhibitor Wi-Fi network this year, which may have produced lower demand for ADSL. That said, our expectation is for continued demand for DSL service in the future.
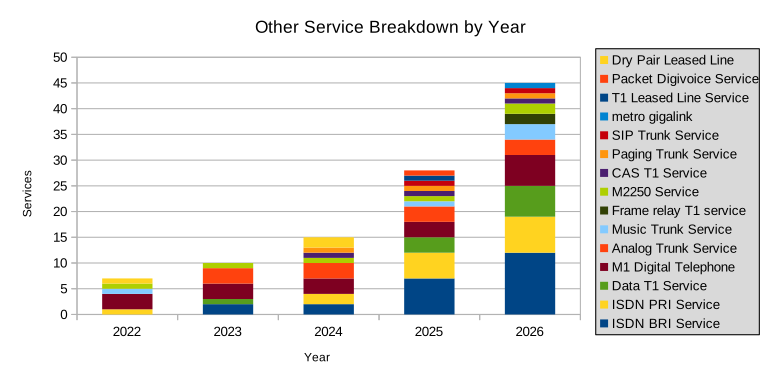
We can have a more in-depth look at the less common services delivered over the years as well. We can see as the years go on, more and more services are offered by Shadytel and the other LECs.
ISDN BRI service has generally been low to zero demand from the general exhibitors, but this year we successfully demoed ISDN video conferencing phones which resulted in provisioning a couple more BRI lines than we did last year plus a few more requests from exhibitors.
T1 voice and data services have been available at VCFMW since the early days of my involvement with the telephone network. Demand was historically sporadic (an ISDN PRI in 2022, a data T1 in 2023), but has been increasing the past couple of years. In 2024, two ISDN PRIs were provided to customers as well as a T1 for a channel bank. In 2025, an ISDN PRI customer and the channel bank customer returned and a new set of customers utilizing an additional 4 ISDN PRIs, 3 data T1s, and a T1 leased line were added. This year, we swapped the leased line out for a pair of frame relay circuits and added a few more PRI and data subscribers. We also had some fractional PRI/data customers.
With 11 T1s delivered outside of the CO, we were close to full utilization on our HDSL2 equipment. We considered adding a second HDSL shelf this year, but ended up just inside the capacity of the single shelf.
For the past 3 years, the step switch demo (brought by incompetel) has used 3 analog trunks: one for placing calls into the step switch from the rest of the network, one for placing 9+ calls into the rest of the network from the step switch, and one for dial-0 operator access from the step switch.
In 2022, one dry pair was leased to deliver a digital telephone line from a Comdial PBX. In 2024, one dry pair was used for a similar arrangement serving a digital telephone from a BCM50 while another dry pair was set up for use with an IBM 5250 terminal using baluns to transport the signal over twisted pair wiring. I don't know if the 5250 terminal was ever set up.
Across all of the years, a few digital telephones have been used in the CO for ACD queue purposes, as well as outside the CO by exhibitors or for telephones placed at the VCFMW HQ tables.
AMPS cellular telephone service was configured for 29 telephones.
Music trunks are generally used to provide hold music to a PBX. They have been used for this purpose at VCFMW, but this has not been counted as a service since it constitutes an internal piece of the network. However, in 2022, a music trunk was used for an audio feed from the talks room. In 2023 and beyond, this was not possible since the talks room was now outside the service area. Last year, however, a music trunk was utilized for a talking clock. And this year, that was done again, plus one order from a subscriber.
The M2250 attendant console has been used to provide operator services by Shadytel since at least 2022.
The past three years, a paging trunk has been configured to reach the overhead PA announcement system from a telephone. The telephone trunk mostly got used by Shadytel staff to make announcements regarding telephone services and occassionally other matters. This trunk is protected from unprivileged users and can only be reached by show and telephone company staff.
Lastly, a SIP trunk was used to link the AMPS system back to the rest of the network and some IP phones were used by one of the other LECs.
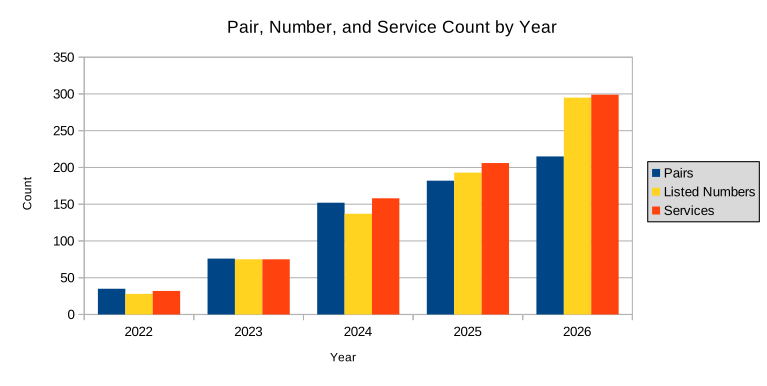
We can see how the pair and listed DN count track with service and pair count above. The discrepancies are explained by some of the following:
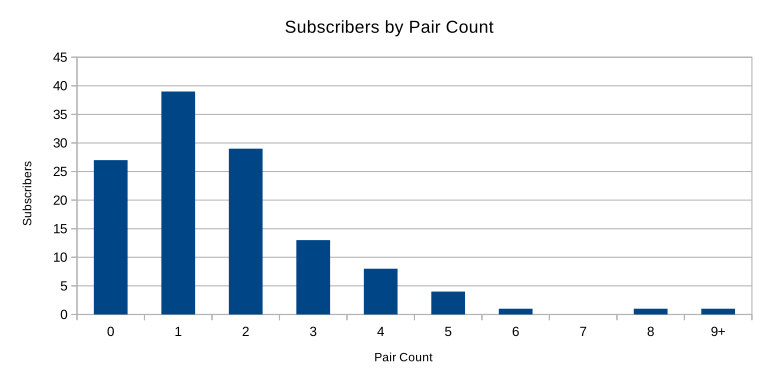
Above, we see the distribution of pair count by subscriber for this year. We have a concentration of subscribers with 0 pairs, these are a mix of the novelty-bill-only subscribers and the AMPS-cellular-only subscribers. Past that, we see, similar to last year, that most subscribers are concentrated at the lower pair counts. Finally, the one subscriber with more than 8 pairs is, of course, the phone company themselves.
This year, Shadytel had 13 pairs. This is just one more than last year.
Increases in space and service count plays a big role in the amount of outside cable plant used at VCFMW. For a description of the VCFMW cable plant, see the OSP diagram.
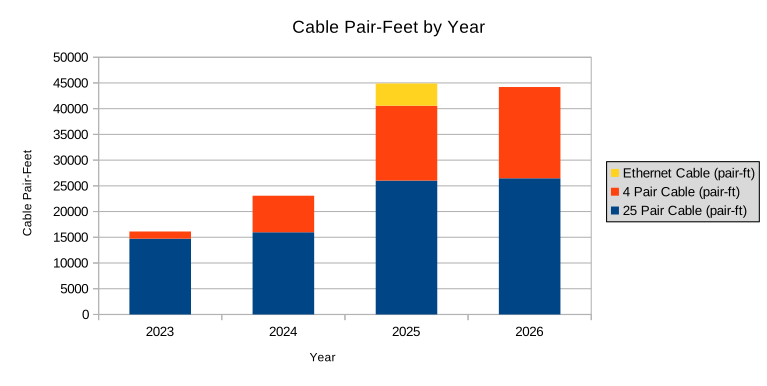
Since the cable plant consists of a mixture of 4 pair cable and 25 pair cable, the metric used is 'pair-feet'. This is a straightforward calculation: the number of pairs in a given section of cable multiplied by the length of that section in feet produces the number of pair-feet for that section. The chart above shows the sum of all sections, grouped by 25 pair or 4 pair cable type.
In 2023, we used primarily 25 pair cable with breakouts spaced periodically. To reach some more distant subscribers, 4 pair cable was used.
In 2024, the cable plant design changed to take more advantage of the 4 pair cable along with shadyrate interfaces as a NID. As such, the 25 pair cable was used more efficiently and the 4 pair cable saw substantial increase in usage over prior years. Overall, the number of pair-feet of cable increased about 43% owing to growth in subscribers, pairs per subscriber, and the size of the venue.
In 2025, the number of pair-feet used for telephony increased about 76%. The usage of cable was somewhat more efficient that year (more on that later), but the increase in cable can be directly correlated to the multiplicative increase in subscriber pairs and exhibitor floor space.
We also used an additional 4300 pair-feet of 4 pair cable (not counted in the telephone cable growth above) for the wifi access points, which were new that year.
This year, we had some significant changes which resulted in much lower growth in pair-feet.
Firstly, the ethernet runs were replaced with about 1,450 feet of fiber (not shown in the chart).
Then a remote CO was used with fiber backhaul to the host CO. Rather than 4 25pr cables spanning the 146 feet between host and remote COs, we had fiber and one 25pr tie cable (for special circuits which couldn't be served directly from the remote CO) saving something like 11,000 pair feet of cable.
Finally, I did my best to use all 4 pairs in each 4 pair drop line (which run from the base of a telephone pole to the individual exhibits). In previous years, I always left a spare pair in any drop line if I could just in case an additional line needed to be provisioned. That turned out to be a rare occurrence, so I dropped that habit beginning with this year.
To make some attempt to calculate cable utilization, we consider the total number of pair-feet vs. the pair-feet that were actually used to deliver services. For each pair in use, I calculated the length of the pair from the subscriber through the cabling back to the CO. End stubs were not counted if they weren't part of the path to the subscriber, and unused pairs were not counted. Overall, this gives an idea of how efficiently the cable was used.
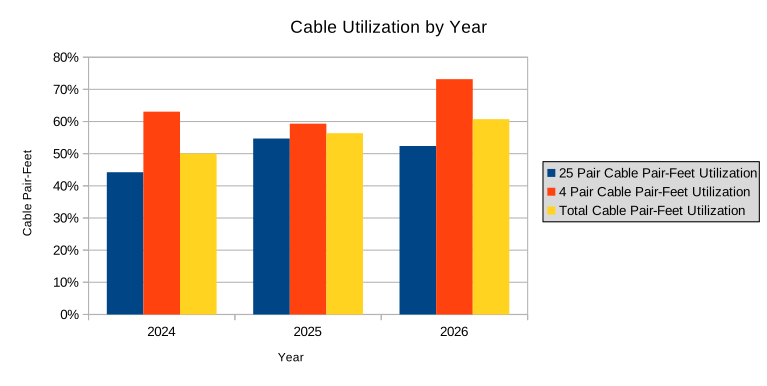
Due to the increase in subscriber pairs, we were better able to utilize the pairs in the 25 pair cables resulting in increased utilization from 44% in 2024 to 55% in 2025, with a slight drop to 52% this year. The 4 pair telephone cable had its highest utilization this year: 73% as compared to 63% in 2024 and 59% in 2025. Overall, the utilization improved counting both 25 pair and 4 pair cabling together from 56% in 2025 to 61% this year.
I did not attempt to calculate cable pair utilization for 2023, however due to the major design change in outside cable plant, I suspect there was a substantial utilization improvement in subsequent years. A quick estimation suggests the cable pair-feet utilization in 2023 may have been as low as 20%.
We can also use some of the data from the cable utilization to find the average cable pair working length. It was about 113 feet in 2024, 149 feet in 2025, and now down to 140 feet in 2026. The longest single working pair this year was 370.5 feet, a significant increase over last year's longest pair at 336 feet.
There is a lot of info that can potentially be derived from the CDRs that were collected at VCFMW. We collected over 5,600 CDRs, although some of these are effectively duplicates or even triplicates (the same call appearing on multiple switches) and nearly 3,700 are remaining after a simple attempt at deduplicating these CDRs. This is a modest increase prior to deduplication from about 5,400, and a larger ~45% increase after deduplication from 2,551 the previous year. There were fewer CDRs to deduplicate since we fixed an issue in handling Cisco IOS CDRs which are nearly 100% duplicated since an 'answer' and 'originate' CDR are produced for most calls.
The total sum of all call duration time is over 6.3 days without deduplication, and over 4.5 days with deduplication. That equates to an average of nearly 4 calls in progress over the course of the weekend (about 28 hours of show operation, over friday, saturday, and sunday).
Lastly, those numbers don't account for internal calls on the step switch demo which clocked 993 first-selector-cutins, a decrease of 28% over last year at 1373. This may have been the result of an intentional decision to not place a telephone directory near the step switch. The goal of the switch is to demo calls on it, rather than tie it up with calls to other network destinations.
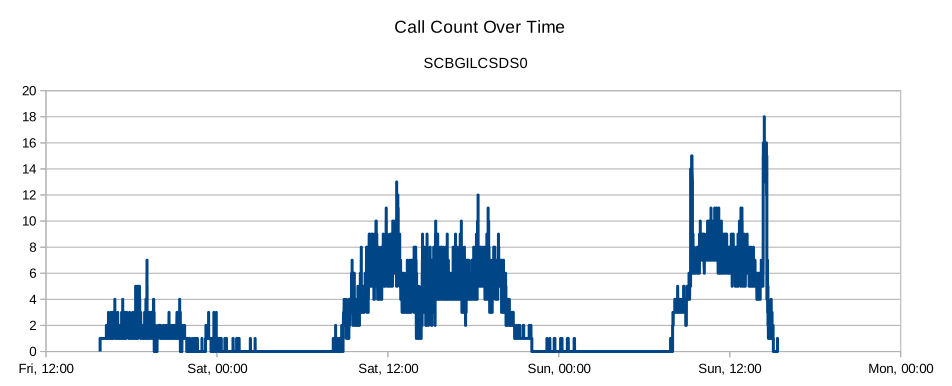
The chart above shows the call count in the Meridian 1 telephone switch over the course of the weekend. Some of the calls late at night are LEC staff 'testing' the system. The spikes on Sunday are some tests of ISDN video conferencing equipment resulting in 8 simultaneous calls in each instance.
An interesting thing to note is that call count didn't drop below 2-3 calls for large portions of time on Saturday, and stayed above 4-5 calls for large portions of Sunday, illustrating the degree to which the telecom network is used.
The top ten longest calls are briefly described below:
A lot of those are dialup internet (x3000), Steve K's BBS, Never Never Land BBS, or MoBATCH. This trend continues down the list for a ways.
There are a few angles from which to consider top destinations: number of calls and number of minutes crossed with looking at individual numbers vs. entire subscriber accounts. The destinations that terminated the most billable minutes of traffic are as follows:
The destinations that terminated the most billable calls are as follows:
The accounts that terminated the most traffic by duration are as follows:
The accounts that terminated the most billable calls are as follows:
As a final point to this section, looking only at billable calls is a bit flawed to see destination statistics. There were calls placed from outside the show in some quantity, and those calls may not have been billable but that doesn't mean they're not real traffic. Filtering for billable calls is an attempt to eliminate the influence of duplicated CDRs.
Similar to the previous section, these are the top ten origins. First we'll look at top ten lines by minutes:
And here are the top ten by calls:
The accounts that originated the most traffic by duration are as follows:
The accounts that originated the most billable calls are as follows: